


 2 / 8
2 / 8

B.N. Korobets
136
ISSN 1812-3368. Вестник МГТУ им. Н.Э. Баумана. Сер. Естественные науки. 2016. № 6
The second group includes the results of research and development represented
by intellectual property (RIA) listed in the Russian Civil Code.
The third group comprises standalone technologies consisting of results of intel-
lectual activity.
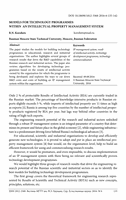
We would note that each RSTA can be used in various research and development
projects to produce new RIAs. In its turn, each RIA can be used to generate new tech-
nologies.
Similarly, several RSTAs can be required
to create an RIA, and several RIAs are neces-
sary to create a technology. Figure 1 shows a
flow chart for new technology creation.
Each circle in Figure 1 corresponds to a
research result. Circle (
i
,
j
) corresponds to the
j
th
research result of the
i
th
layer. Circles (1,
j
)
and (2,
k
) are linked by arc [(1,
j
), (2,
k
)]
if the
j
th
layer RSTA is used to develop the
second layer k. Circles (2,
j
) and (3,
k
) are
linked by arc [(2,
j
), (3,
k
)] if RIA
j
is used to
create technology k.
Each research result (RSTA, RIA, technology) features four parameters:
−
cost of creation (
c
ij
);
−
time of creation (
t
ij
);
−
risk of creation (
p
ij
);
−
research level (
w
ij
).
Let’s break down all types of technologies into r groups (areas).
Q
j
will mean a set
of technologies of the
j
th
area.
The following value
i
i
ij
j Q
W w
determines the research level (RL) of the
i
th
technology area. We would then introduce
a qualitative three-point RL scoring scale. To do this, we need to determine threshold
levels
,
1, 2.
ik
A k
If
,
i
i
ij
j Q
W w
then the RL is below the global level; if
1
2
,
i
i
i
A W A
then the RL is at par with the global level. Finally, if
2
,
i
i
A W
then
the RL is above the global level.
Let
q
i
be the qualitative score of the RL for the
i
th
technology area. To assess the
RL of the technology area in general, we will introduce a comprehensive RL scoring
system [5]. The system is a pair-wise aggregation of area scores based on matrix con-
volutions. Figure 2 provides an example of comprehensive scoring for four areas.
The comprehensive scoring system reflects the strategic priorities in technological
development [6]. For instance, the lower left matrix (Fig. 2) implies that direction 1
has a certain development priority over direction 2. Indeed, if we assess directions
Fig. 1.
Flow chart for new technology
creation